Debugging Slow Neos Backend Performance in Kubernetes with strace
by Sebastian Kurfürst on 03.08.2019We had a few sites with slow Neos Backend Performance – this is the debugging story of tracing the root cause, and fixing it.
My colleagues approached me a while ago that certain operations in the Neos backend for sandstorm.de were quite slow, especially publishing content to the live site. I had some troubles understanding the issue at first, as when I used the website, I did not have this issue - which was very strange. (It makes sense in retrospective, explanation at the bottom 😜 ). The frontend was running nicely as well.
Challenge 1: Accessing the Kubernetes pod with a debugging tools
We are running our own Neos application Docker images inside Kubernetes – and we try to trim these images down as much as possible. That means, while a shell is generally available, many system tools like top, ps, etc are missing in the container – and vim as editor is also missing.
How to solve this?
A while ago, I found kubectl debug, which is an addon for kubectl. It injects a so-called sidecar container to the pod which we want to debug. This sidecar container shares the process namespace, networking, and some more things with the main worker container. Furthermore, this container contains a bunch of debugging tools, like top, dig, curl, strace, and also vim as an editor.
Let's start kubectl debug:
kubectl debug --agentless --port-forward sandstorm-website-pod
We can now run top and all the other tools to inspect the running container.
One problem we still need to overcome is that the container filesystem is not shared. However, we can access /proc/1/root/, which contains the root file system of the other container. Thus, if we want to edit /app/flow in the Neos application, we instead need to edit /proc/1/root/app/flow from our debug container.
✅ we now have good debugging tools using kubectl debug
Challenge 2: Why is Neos slow?
When my colleagues showed me the problem first-hand, I was finally able to see the issue myself. Publishing changes took a long time, until we got a timeout. To get a first understanding what was going on, I fired up top while the publishing was running - and this is what I saw:
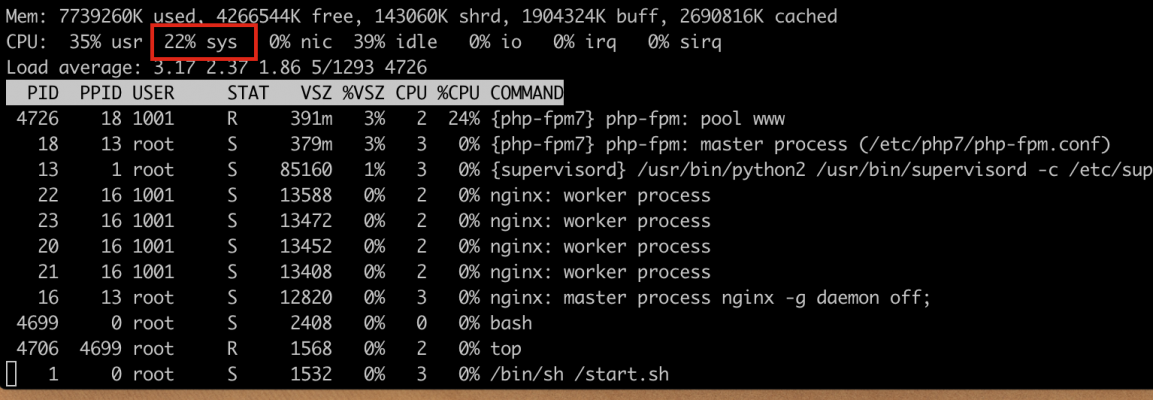
I immediately noticed that the sys value of the CPU is extremely high. What does this mean?
A little more background about system calls:
Every program (like PHP or NGINX) runs in so-called "user-space". Now, if the program wants to access the network (e.g. read from a socket), or read or write to a file, it cannot do this on its own, but it needs to ask the kernel instead. This is done through system calls.
When a system call is executed, the execution context is switched to kernel-space. First, the kernel checks whether the caller is allowed to execute that system call. Then, the kernel will do the actual work. When this is finished, the system call returns some values (like a file descriptor or some bytes read from a file), and the execution context switches back to user-space.
Back to our debugging session.
To sum it up, sys is the time which is spent in kernel-space, while usr is the percentage of time spent in the user-space application (i.e. PHP). We can deduce from the long time in the kernel-space, that either the program executes many system calls, or the system calls need a long time to return.
✅ we now have a theory that the slowness has something to do with system calls.
Challenge 3: How can we debug system calls?
That was the point where I needed to google a while, until I encountered some blog posts about strace - a tool which lists the system calls made by a program (including all arguments). I have read about strace before, but have never used it so far. This will change - for sure 😃.
strace has a (for us) extremely important feature: It allows to attach to a running process. This means we do not need to restart our PHP server process 💪 (which would not be possible easily, as when killing/restarting this process, it might be rescheduled by Kubernetes) ...
Furthermore, strace has a -c flag which outputs statistics - to get a quick overview first. So, I reproduced the issue, read the process ID of the PHP interpreter with high load (e.g. using top), and then I connected strace to this process using -p:
bash-5.0# strace -c -p 4792
strace: Process 4792 attached
After a few seconds, I pressed Ctrl-C to abort strace, and got a nice summary:
bash-5.0# strace -c -p 4792
strace: Process 4792 attached
^Cstrace: Process 4792 detached
% time     seconds  usecs/call     calls    errors syscall
------ ----------- ----------- --------- --------- ----------------
 17.64    0.162565          18      8954           open
 17.51    0.161426           9     17907           flock
 11.72    0.108023           6     17907           lseek
 11.45    0.105505          15      6952           lstat
  9.43    0.086904           9      8953           fstat
  8.91    0.082153           9      8954           read
  8.61    0.079376          17      4477           stat
  8.36    0.077037           8      8955           close
  5.87    0.054143           6      8954           clock_gettime
  0.49    0.004514          35       127           getdents64
  0.00    0.000003           3         1           fcntl
------ ----------- ----------- --------- --------- ----------------
100.00    0.921649                 92141           total
😯 WOW - that are many file-related system calls!
Let's see what these are doing - which files are read. Thus, we simply execute strace -p [pid], and get a looong output until we abort again using Ctrl-C:
bash-5.0# strace -p 4813
strace: Process 4813 attached
open("/app/Data/Temporary/Production/SubContextKubernetes/Cache/Data/Neos_Fusion_Content/0e8374b212d058d69d766884db1a9415", O_RDONLY) = 10
fstat(10, {st_mode=S_IFREG|0644, st_size=936, ...}) = 0
lseek(10, 0, SEEK_CUR)                  = 0
flock(10, LOCK_SH)                      = 0
lseek(10, 850, SEEK_SET)                = 850
read(10, "NodeType_%d0dbe915091d400bd8ee7f"..., 8192) = 86
flock(10, LOCK_UN)                      = 0
close(10)                               = 0
stat("/app/Data/Temporary/Production/SubContextKubernetes/Cache/Data/Neos_Fusion_Content/0041c8a60db43a216d88774c55e9023c", {st_mode=S_IFREG|0644, st_size=239, ...}) = 0
clock_gettime(CLOCK_REALTIME, {tv_sec=1564827159, tv_nsec=119236958}) = 0
lstat("/app/Data/Temporary/Production/SubContextKubernetes/Cache/Data/Neos_Fusion_Content/0041c8a60db43a216d88774c55e9023c", {st_mode=S_IFREG|0644, st_size=239, ...}) = 0
open("/app/Data/Temporary/Production/SubContextKubernetes/Cache/Data/Neos_Fusion_Content/0041c8a60db43a216d88774c55e9023c", O_RDONLY) = 10
fstat(10, {st_mode=S_IFREG|0644, st_size=239, ...}) = 0
lseek(10, 0, SEEK_CUR)                  = 0
flock(10, LOCK_SH)                      = 0
lseek(10, 229, SEEK_SET)                = 229
read(10, "153       ", 8192)            = 10
flock(10, LOCK_UN)                      = 0
close(10)                               = 0
clock_gettime(CLOCK_REALTIME, {tv_sec=1564827159, tv_nsec=121527527}) = 0
lstat("/app/Data/Temporary/Production/SubContextKubernetes/Cache/Data/Neos_Fusion_Content/0041c8a60db43a216d88774c55e9023c", {st_mode=S_IFREG|0644, st_size=239, ...}) = 0
open("/app/Data/Temporary/Production/SubContextKubernetes/Cache/Data/Neos_Fusion_Content/0041c8a60db43a216d88774c55e9023c", O_RDONLY) = 10
(I'll leave out the other 50 000 lines to keep the blog post shorter 😜)
If we watch closely, we see that all of these file system requests are related to a Neos cache called Neos_Fusion_Content.
✅ we understand the root cause of the issue – and strace is pretty damn cool
Challenge 4: Fixing the issue
Luckily, this part was easier for me (because I know Neos very well)– Neos caches can be easily switched from the default file-system caches to other cache backends like Redis. We can easily change the cache backends, using Caches.yaml for the production deployment. Based on the config shared by our friends at Flownative, and our own Sandstorm.OptimizedRedisCacheBackend package, the issue is gone with the following Caches.yaml:
Closing thoughts
To sum it up:
- We can really recommend kubectl debug to debug problems in a Kubernetes pod.
- strace is really cool and powerful! I will play around some more with it, because it gives great insight into running processes. I am really happy to have strace in my toolbox now!
- For Neos, ensure you use the Redis Cache Backend, at least for Neos_Fusion_Content, starting at medium-sized sites.
I 💙 to have feedback! If you have questions or other great tools you want to share, find me most easily on twitter @skurfuerst.
Hope you had fun reading this, as much fun as I had discovering and fixing this issue,
Sebastian
PS: You might wonder why we did not have Redis configured beforehand? Well, we simply did not need it for sandstorm.de when we got started – but the issue got bigger over time the more content we produced. Then, I simply forgot to enable it lateron.
PPS: This also explains why it was so hard for me to reproduce the issue: I often tested the site quickly after I deployed some changes - and then, the caches were flushed. Thus, there were a lot less files in the cache, and the problem did not surface. On the other hand, when my colleagues used Neos regularily to edit content, the cache was quite filled already; and the problem appeard.